
.avif)
.avif)
.avif)

Browse all articles
If you're searching for how to improve Core Web Vitals, you're probably feeling one of these:
- Rankings slipped even though your content didn't change
- Traffic is flat, but competitors are creeping up
- Your site "feels" slower than it should
- PageSpeed Insights is red and you're not sure what to do first
Here's the part most people miss: Core Web Vitals optimization isn't about doing everything. It's about doing the right thing first—because one or two fixes often move the needle more than 20 micro-tweaks.
This post gives you a practical Core Web Vitals audit you can run in about 15 minutes to identify what's actually failing, why it's failing, and what to fix to improve your Core Web Vitals score (and protect your SEO performance).
Why Core Web Vitals matter for SEO (and why you feel it before you see it)
Google's page experience signals include Core Web Vitals—real-user performance metrics that reflect speed, responsiveness, and visual stability.
That matters for rankings, but it also matters for money:
- Slow pages lose people before they even read your headline
- Laggy pages kill trust ("this site feels broken")
- Shifty layouts cause misclicks, friction, and drop-offs
If you're wondering about the Core Web Vitals impact on SEO rankings, think of it like this: you can have great content, but if the experience is frustrating, Google has less incentive to put you on top—especially when competing pages are faster and smoother.
The good news: you don't need to become a performance engineer to pass Core Web Vitals. You just need a repeatable process. And if you're working with Webflow (like many of our clients do), you're already starting with a platform that makes performance optimization way more manageable than most CMS options.
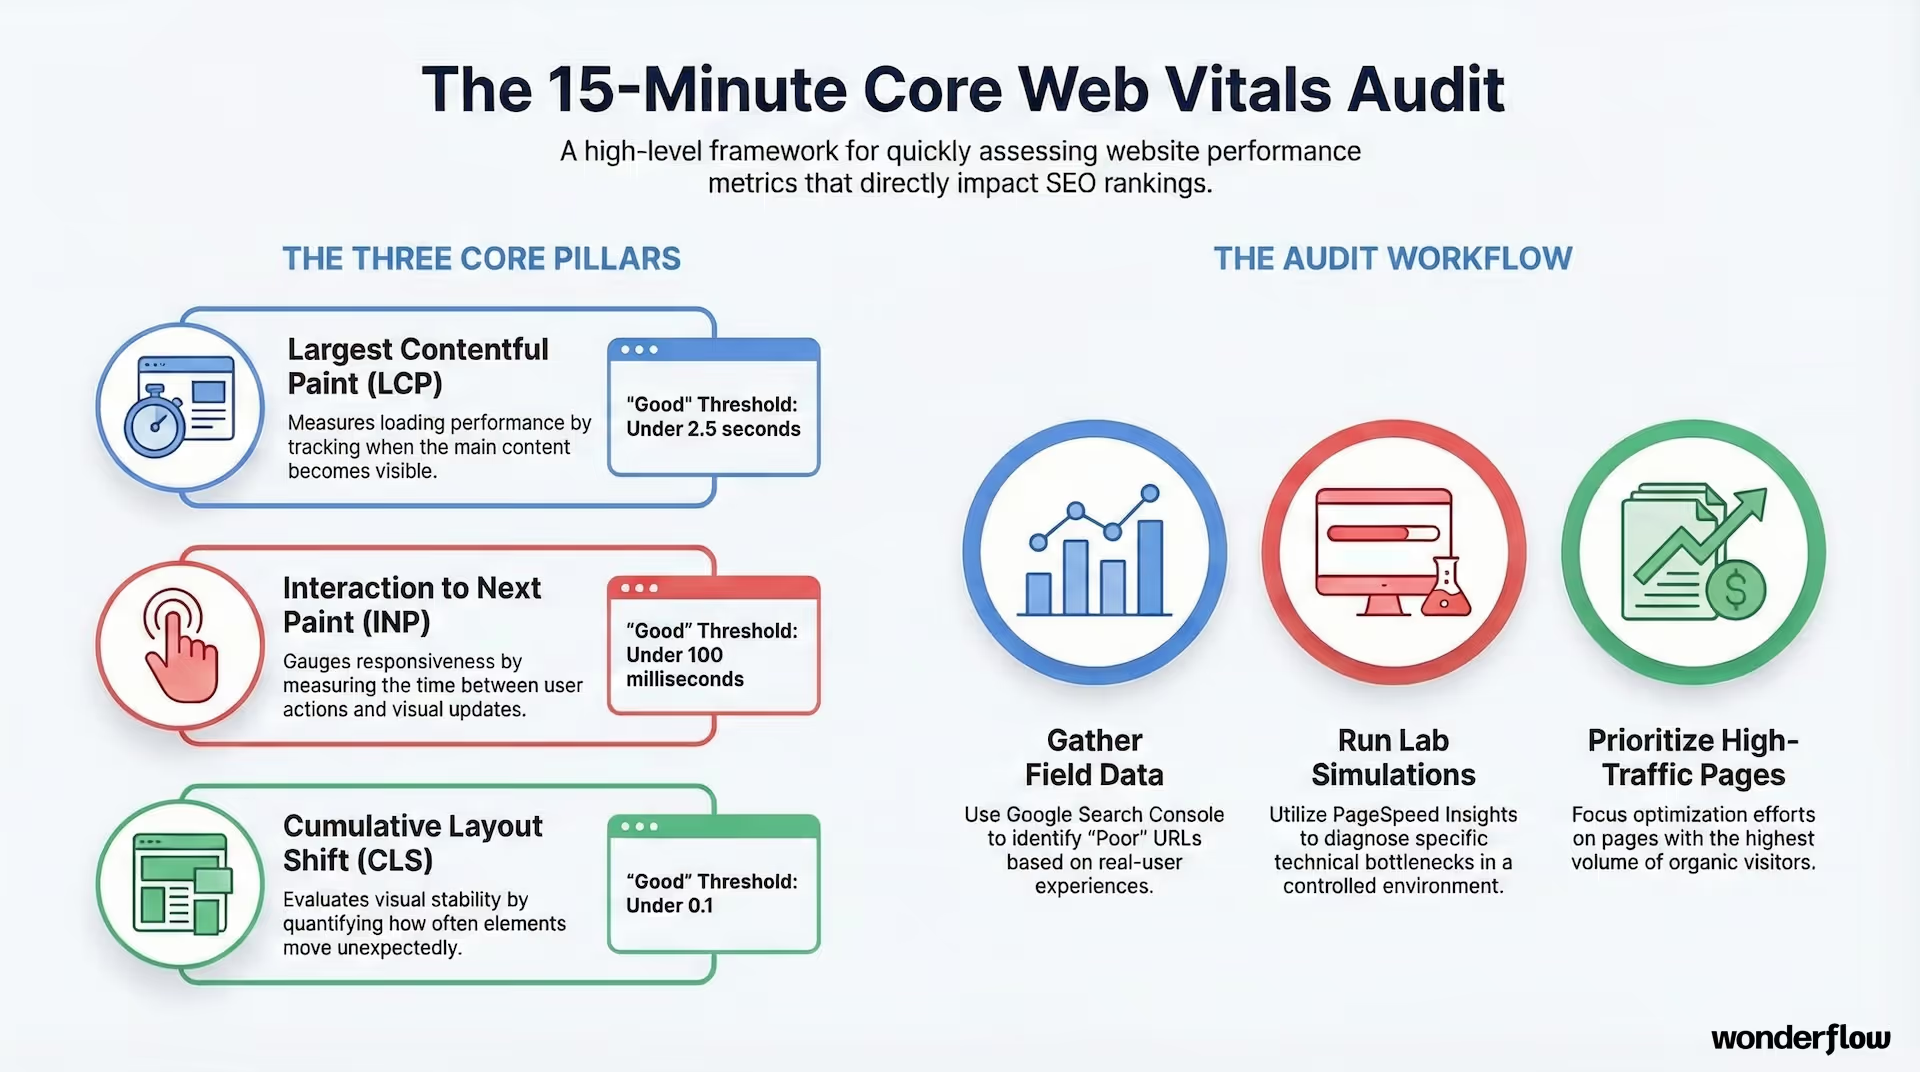
The 15-minute Core Web Vitals audit (quick, not hand-wavy)
Before you try to fix Core Web Vitals issues, you need to answer two questions:
- Which metric is failing?
- Is the problem real-user (field) or test-lab (lab)?
That's the whole game.
Minute 1–3: Start with field data (because that's what Google uses)
Open one of these:
- Google Search Console → Experience → Core Web Vitals
- PageSpeed Insights (PSI) → look for "Field Data" (CrUX)
This is the "real world" view: actual users on actual devices. If your goal is improving SEO, field data is the scoreboard.
If PSI says "insufficient real-user data," don't panic—use lab testing (below) as your guide until you have enough traffic.
Minute 4–7: Pick one URL that represents the problem
In Search Console, Google groups similar pages together. Click an issue (e.g., "LCP issue: longer than 2.5s") and grab one example URL.
Don't audit 20 pages. Audit one "representative" page type:
- homepage
- landing page
- blog template
- product/service page
That's how you fix failing Core Web Vitals efficiently. When we work with clients on marketing flow optimization, we typically start with their highest-traffic landing pages—the ones driving demos, trials, or signups. That's where performance improvements compound into revenue.
Minute 8–10: Check lab data to find the cause
Now run:
- PageSpeed Insights (Lab) or
- Chrome DevTools → Lighthouse (Performance)
Lab data won't perfectly match field data (different device/network, fewer variables), but it's fantastic for diagnosis. This is your tutorial moment: lab tells you what to change, field tells you if it worked for real people.
Minute 11–15: Identify the failing metric + apply the highest-ROI fix
Core Web Vitals are just three things:
- LCP optimization: how fast the main content shows up
- Improve INP score: how fast the page responds when someone interacts
- Reduce CLS: how stable the layout is while loading
Let's break down exactly what to do for each.
The thresholds (so you know what "good" looks like)
You're aiming to improve page experience metrics until you're in the "Good" range:
- LCP (Largest Contentful Paint): under 2.5s
- INP (Interaction to Next Paint): under 200ms
- CLS (Cumulative Layout Shift): under 0.1
If you're trying to pass Core Web Vitals, don't chase perfection. Get into "Good," then move on to higher-leverage growth work. We've seen teams waste months obsessing over getting a perfect score when their real problem was conversion rate, not load time.
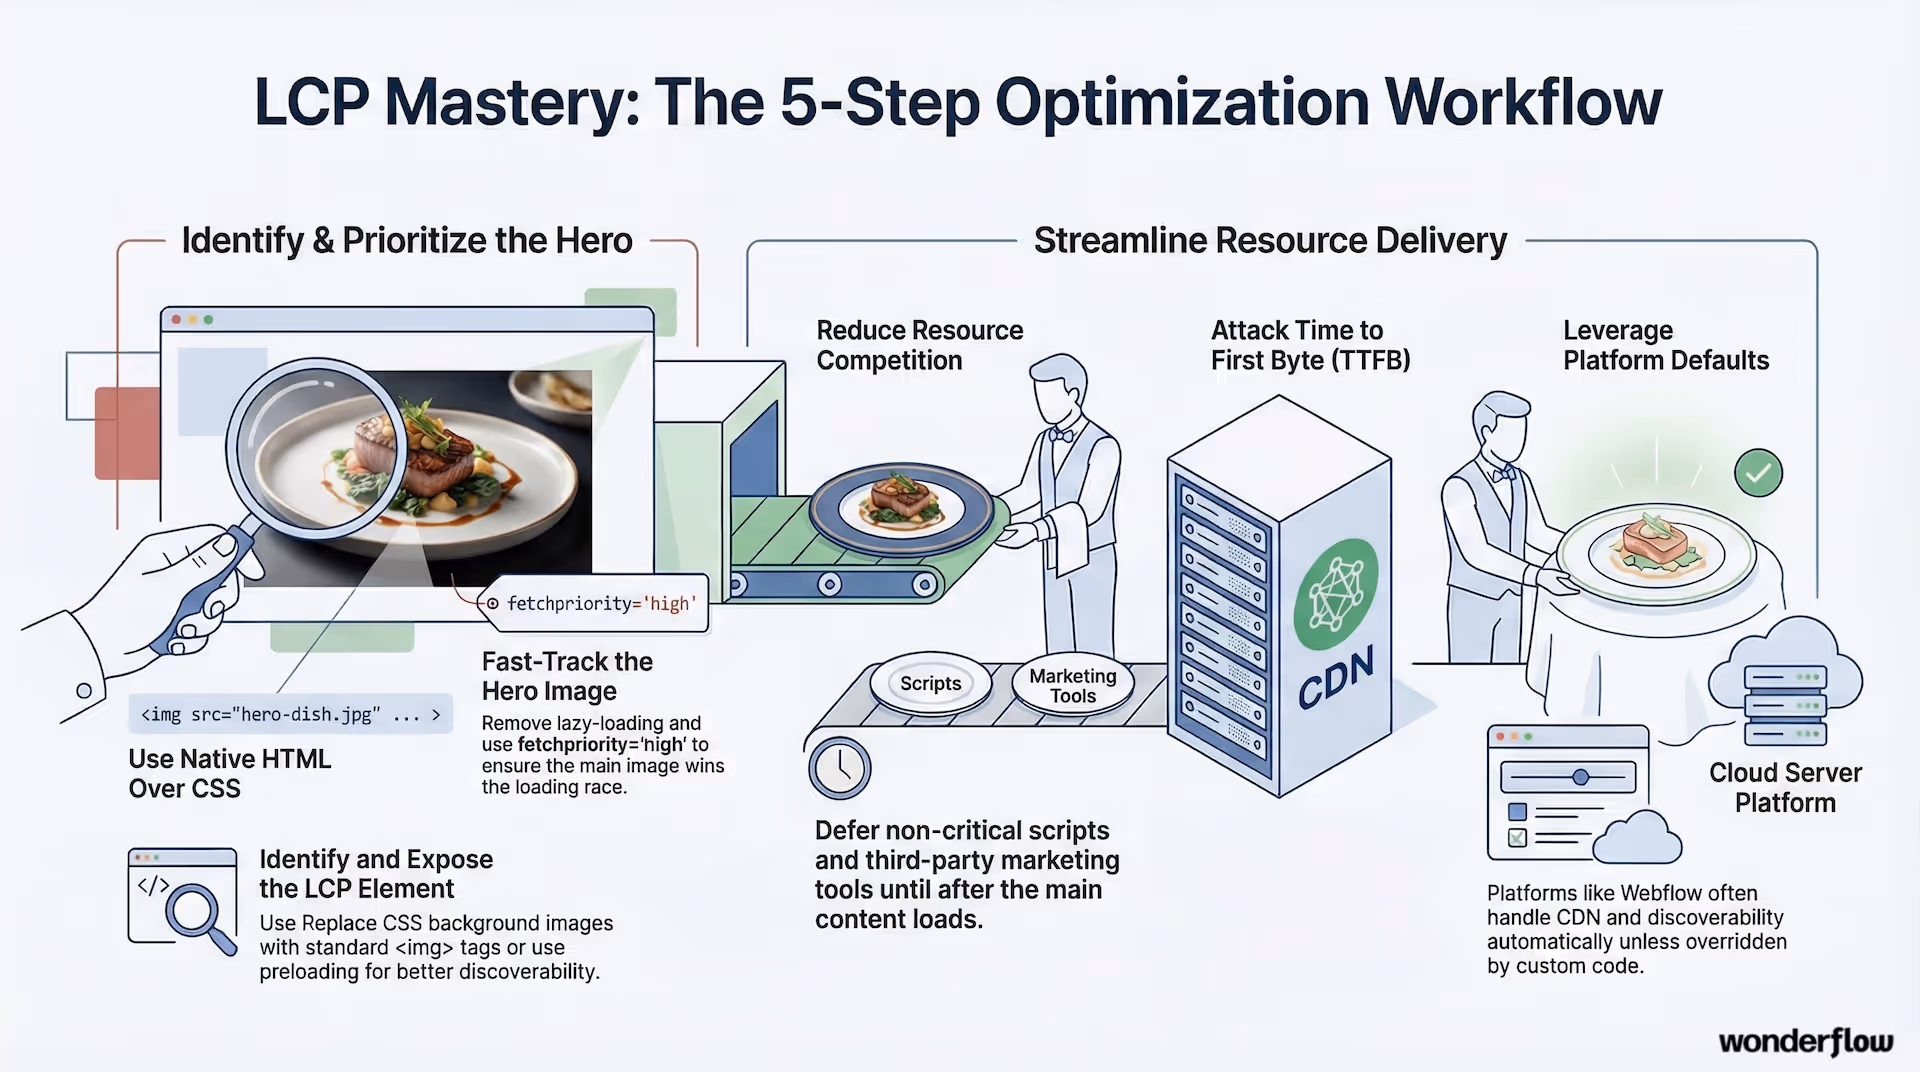
LCP Optimization: Fix your "main dish" arriving late
If you only fix one thing on most sites, make it LCP.
A huge share of pages have an image as the LCP element—usually a hero image. When that image is delayed, the whole page feels slow, even if the rest is fine.
Step 1: Identify your LCP element
In PageSpeed Insights, look for "Largest Contentful Paint element."
It'll show you what it is (image, heading, block, etc.).
This is the fastest path to optimize largest contentful paint.
Step 2: Make the LCP resource discoverable immediately
The browser can only load what it can "see." A classic LCP killer is hiding the hero image behind JavaScript or nonstandard attributes.
High-ROI LCP fixes:
- Use a real
<img src>/ srcset (notdata-srcthat requires JS) - Avoid client-only rendering for the above-the-fold hero when possible
- If the hero is set via CSS background image, consider switching to an
<img>or preloading it
This is the unsexy part of web performance optimization—but it works. If you're on Webflow, the good news is that the platform already handles most of this correctly by default. Just make sure you're not overriding it with custom code or lazy-loading scripts.
Step 3: Prioritize the hero image (and stop fighting the browser)
If you're trying to optimize LCP for mobile, bandwidth and CPU are tighter. You want the hero to win the loading race.
Do this:
- Remove
loading="lazy"from the LCP image - Use
fetchpriority="high"on the LCP image (where supported) - Consider
<link rel="preload">if the image isn't discovered early enough
Step 4: Reduce competition
LCP often gets slower because other things are stealing resources.
Easy wins:
- Defer non-critical scripts (
defer,async, or load later) - Delay third-party tools until after the main content is visible
- Lazy-load below-the-fold images/iframes
If your PageSpeed report mentions render blocking resources, treat that as a clue—not a guilt trip.
This is especially important if you're running multiple marketing tools. We see this constantly: teams add tag managers, analytics, chat widgets, and conversion tracking without thinking about the performance cost. When we help clients optimize their marketing flows, one of the first things we do is audit which scripts are actually necessary on the landing page vs. which can load after the user converts or engages.
Step 5: Attack TTFB if LCP is blocked at the start
If the server is slow to respond, everything is slow.
To improve Time to First Byte:
- use caching
- serve content closer to users (CDN)
- reduce heavy server work on initial requests
This is especially important for mobile page speed and landing pages used in ads. Webflow handles CDN and caching automatically through their hosting, which is one reason we recommend it for clients who need speed without the DevOps overhead.
Improve INP score: Make your site feel instantly responsive
INP measures how quickly your page reacts when someone clicks, taps, or types.
If your site feels "sticky" or laggy—buttons respond late, menus hesitate—your INP is probably struggling.
And yes, this matters even if your Lighthouse speed score looks okay. A page can load fast but still feel broken if it doesn't respond to interaction.
Step 1: Find the slow interaction
Open Chrome DevTools → Performance
Record, then do a real interaction (click a menu, open a modal, submit a form).
You're looking for:
- long tasks (main thread blocked)
- heavy scripting tied to the interaction
This is the most direct way to reduce interaction to next paint and reduce INP response time.
Step 2: Reduce unnecessary JavaScript
Most INP problems are "too much JS doing too much work at the wrong time."
High-ROI fixes:
- remove unused JS (DevTools Coverage is your friend)
- code-split bundles so non-critical code loads later
- audit Tag Manager: old tags, heavy vendors, duplicate scripts
If you have a bunch of marketing scripts, this is where the truth lives. We've audited sites with 15+ tracking scripts running on every page load, half of which were for campaigns that ended years ago. Cleaning that up can cut INP times in half.
Step 3: Break up long tasks (yield often)
When tasks take too long, the browser can't respond quickly. Even if the work is "correct," doing it all at once is a responsiveness killer.
Practical approaches:
- chunk expensive work into smaller pieces
- delay non-urgent work until idle time
- avoid running heavy scripts on page load if they aren't needed immediately
Step 4: Avoid big rendering thrash
Some INP issues aren't "JS is heavy," they're "JS triggers expensive layout changes."
Watch for:
- repeated DOM reads/writes in the same loop
- scroll/resize handlers doing too much
- large DOM updates when opening UI elements
Batch reads, then batch writes. Your browser will thank you.
Reduce CLS: Stop your layout from shifting like a moving sidewalk
CLS is the "why did that button move right as I clicked it?" metric.
If you want to fix cumulative layout shift, the common causes are predictable:
CLS culprit #1: Images or videos with no defined size
If the browser doesn't know how big an element will be, it can't reserve space. When the media loads, the layout jumps.
Fix:
- set
widthandheightattributes, or use CSSaspect-ratio
CLS culprit #2: Late-loading banners and embeds
Cookie banners, chat widgets, ad slots, embedded iframes—if they appear and push content down, CLS spikes.
Fix:
- reserve space using placeholders or
min-height - avoid injecting content above the fold without reserved space
This is the heart of preventing layout shift issues. We've seen companies lose conversion rate purely because their cookie banner or live chat widget loaded late and shifted the CTA button just as someone was about to click it.
CLS culprit #3: Fonts loading late (FOUT/FOIT)
If fonts swap after paint, text can resize and shift.
Fix:
- preload critical fonts
- use a sane
font-displaystrategy - choose fallback fonts with similar metrics
CLS culprit #4: Animations that move layout
Animating top, left, margin, etc. can cause layout shifts.
Fix:
- animate using
transforminstead (GPU-friendly, layout-safe)
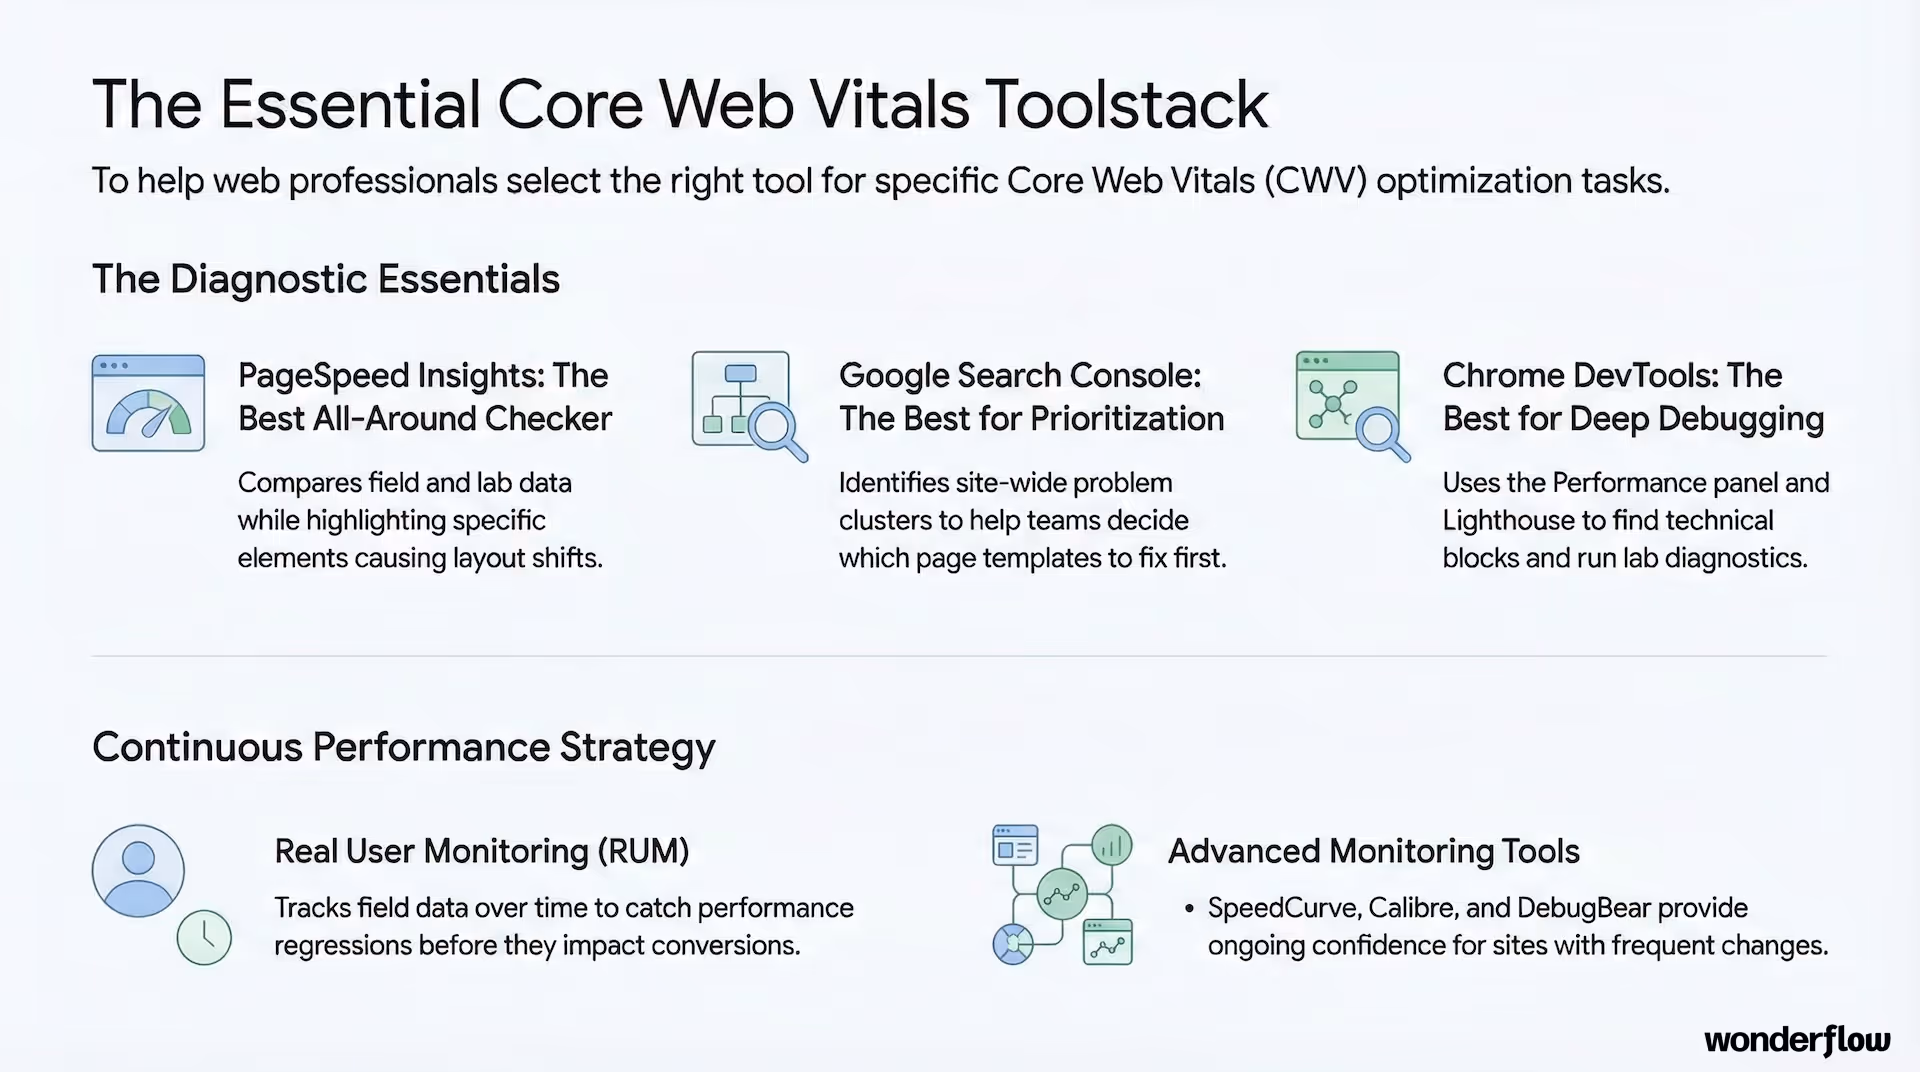
Tools to check Core Web Vitals (and what each is best at)
If you're searching for tools to check Core Web Vitals, this is the practical stack:
1) PageSpeed Insights (best all-around)
- shows field data vs lab data
- highlights LCP element, layout shifts, and common issues
It's basically a free Core Web Vitals checker that's good enough to drive real improvements.
Link: https://pagespeed.web.dev/
2) Google Search Console (best for prioritizing)
- shows site-wide problem clusters
- helps you pick which page template to fix first
Perfect for deciding what will actually move SEO outcomes.
Link: https://search.google.com/search-console
3) Chrome DevTools (best for real debugging)
- Performance panel: find what's blocking INP
- Lighthouse: quick lab diagnostics
If your team is serious about web vitals optimization, this is where the answers are.
4) Real user monitoring (best for ongoing confidence)
If your site changes often (new scripts, new pages, frequent experiments), RUM helps you catch regressions before rankings and conversions suffer.
Tools like SpeedCurve, Calibre, or DebugBear give you field data over time, not just snapshots.
When we're managing a client's marketing flow—especially if they're running paid campaigns with aggressive creative testing—we set up monitoring so we catch performance drops before they hurt conversion rates or ad costs.
The honest truth about "improve Core Web Vitals in 15 minutes"
You can't rewrite your entire site in 15 minutes.
But you can do a quick Core Web Vitals audit in 15 minutes and come away with:
- the failing metric
- the specific page type
- the likely root cause
- the highest ROI fix to test first
That's exactly what most teams are missing. They're stuck in "we should improve performance" instead of "we know what to do next."
A simple prioritization rule (so you don't waste time)
If you want to know how to fix failing Core Web Vitals distilled into one decision tree:
- Start with field data (Search Console / PSI field data)
- If LCP fails: fix hero resource discovery + priority first
- If INP fails: remove unused JS / tame long tasks / fix interaction bottlenecks
- If CLS fails: add dimensions + reserve space + fix late banners/fonts
- Re-test and monitor—don't guess
That's Core Web Vitals best practices in a workflow, not a wall of tips.
Show pages wasting your ad spend? See just how much:
Want help? This is where Wonderflow fits
Most "performance advice" is either:
- too generic ("compress images!")
- too deep ("re-architect your rendering pipeline")
- or totally disconnected from marketing reality (tags, experiments, scripts, tools)
At Wonderflow, we approach Core Web Vitals optimization like a growth problem:
- prioritize the pages that drive revenue (landing pages, high-traffic entry points)
- fix what actually moves field data
- protect performance while marketing keeps shipping
We work with SaaS teams, professional services firms, and event organizers who need high-performance Webflow pages that convert—not just look fast in a lab test.
If you want help, send us:
- 1–3 URLs that matter most (homepage + top landing page is perfect)
- a PageSpeed Insights link or screenshot
- whether the issue shows up more on mobile or desktop
And we'll tell you—plainly—what's hurting you most and the fastest path to improve your Core Web Vitals score without blowing up your site.
Related resources
Want to go deeper on page speed and conversion optimization? Check out these:
- The Complete Guide to Page Speed Optimization for Higher Conversions
- Landing Page Accessibility: The Overlooked Conversion Factor
- How Wonderflow Works (our approach to marketing flow optimization)
And if you're serious about turning performance into pipeline, talk to us about optimizing a flow.
.jpg)
.avif)
.avif)